Why Excel? Excel With Excel Series 1
Welcome To The World Of Analysis With Excel...
Microsoft Excel was released in 1985 and has grown to become arguably the most important computer program in workplaces around the world. Whether you are budgeting, organizing client sales lists, or need to plan an office social gathering, Excel is a powerful tool that has become entrenched in business processes worldwide.
Why Excel?
Among the computer programs which exist, Microsoft Excel is one of the most important because of the key role it plays in many sectors. It is the most used spreadsheet program in many business activities, classwork and even personal data organisation. Since 1985, it has played a vital role in performing formula based arithmetic and calculations, and other activities that may require mathematical calculations. Many businesses, personal and institutional enterprises have embraced the use of Excel because of its utility and the ability to serve as a visual basic for different applications.
BRIEF HISTORY OF MS EXCEL BY CHANDOO (A Versatile Excel Guru)
Some Areas of Excel Functionalities
The importance of MS Excel can be seen in the different departmental units it is used as follows:
Finance and Accounting
If you walk through the finance or accounting department at any major corporate office, you will see computer screens filled with Excel spreadsheets outlining financial results, budgets, forecasts, and plans used to make big business decisions.
This is the area of business with the biggest reliance and benefit from Excel spreadsheets. Advanced formulas in Excel can turn manual processes that took weeks to complete in the 1980s into something that takes only a few minutes today.
Most users know that Excel can add, subtract, multiply, and divide, but it can do much more with advanced IF functions when coupled with VLOOKUP, INDEX-MATCH-MATCH, and pivot tables.
Marketing and Product Management

While marketing and product professionals look to their finance teams to do the heavy lifting for financial analysis, using spreadsheets to list customer and sales targets can help you manage your sales force and plan future marketing plans based on past results.
Using a pivot table, users can quickly and easily summarize customer and sales data by category with a quick drag-and-drop. All parts of business can benefit from strong Excel knowledge, and marketing functions are not exempt.
Human Resources Planning
While database systems like Oracle (ORCL), SAP (SAP), and Quickbooks (INTU) can be used to manage payroll and employee information, exporting that data into Excel allows users to discover trends, summarize expenses and hours by pay period, month, or year, and better understand how your workforce is spread out by function or pay level.
HR professionals can use Excel to take a giant spreadsheet full of employee data and understand exactly where the costs are coming from and how to best plan and control them for the future.
Education
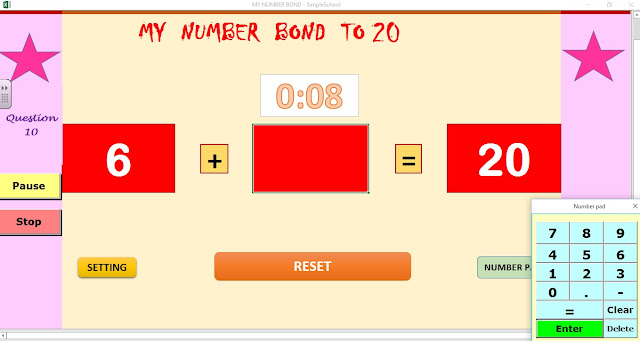
A good use of Excel in schools and educational institutions can automate classroom activities, like games, quizzes and tests. More importantly, it can be used for computation and analysis of test scores, logs, attendance and so on.
For example, Excel based App like SimpleSchool Grading and Analysis App can compute, analyse and generate instant report sheets for students by just inputting the students scores.
Data Organization

Even non-financial businesses employ Excel spreadsheets. The ability to organize data in Excel tables and set up tools for updating, organizing, and displaying the data makes the program popular for administrative purposes.
Comprehensive, easy-to-reference Excel tables allow administrators to check a single statistic in a process, such as service fault issues in a product, against a report of trends for the same service faults. Through these comparisons, issues can be identified and solutions developed.
Programming
Excel supports Microsoft's Visual Basic for Applications programming language for creating macros that increase efficiency and ease of use by automating or simplifying complex functions.
People who are proficient at creating Excel macros are much in demand at organizations of all types.
Graphing
Excel also produces a variety of charts and graphs for representing income statements and other statistical data visually. You save time by making the charts in the spreadsheet where the data resides.
Visual presentation of the data drives home your points more effectively than columns of numbers. Being able to graph within Excel also frees up some capital that otherwise would have to be invested in another graphing program.
You Can Do Anything With a Spreadsheet
Using Excel for business has almost no limits for applications. Here are some examples:
When planning a team outing to a baseball game, you can use Excel to track the RSVP list and costs.
Excel creates revenue growth models for new products based on new customer forecasts.
When planning an editorial calendar for a website, you can list out dates and topics in a spreadsheet.
When creating a budget for a small product, you can list expense categories in a spreadsheet, update it monthly and create a chart to show how close the product is to budget across each category.
You can calculate customer discounts based on monthly purchase volume by product.
Users can summarize customer revenue by product to find areas where to build a stronger customer relationships.
This is a very short list to give you an idea of the diverse uses for Excel.
The Bottom Line
Excel is not going anywhere, and businesses will continue to use Excel as a primary tool for diverse functions and applications ranging from IT projects to company picnics.
A working knowledge of Excel is vital for most office based professionals today, and stronger Excel skills can open the door to promotion and leadership opportunities. Excel is a powerful tool but cannot function alone. It takes a savvy computer user to take advantage of everything Excel has to offer to provide the best results for their company.


Nice on bro!
ReplyDeleteThanks bro.
ReplyDelete